
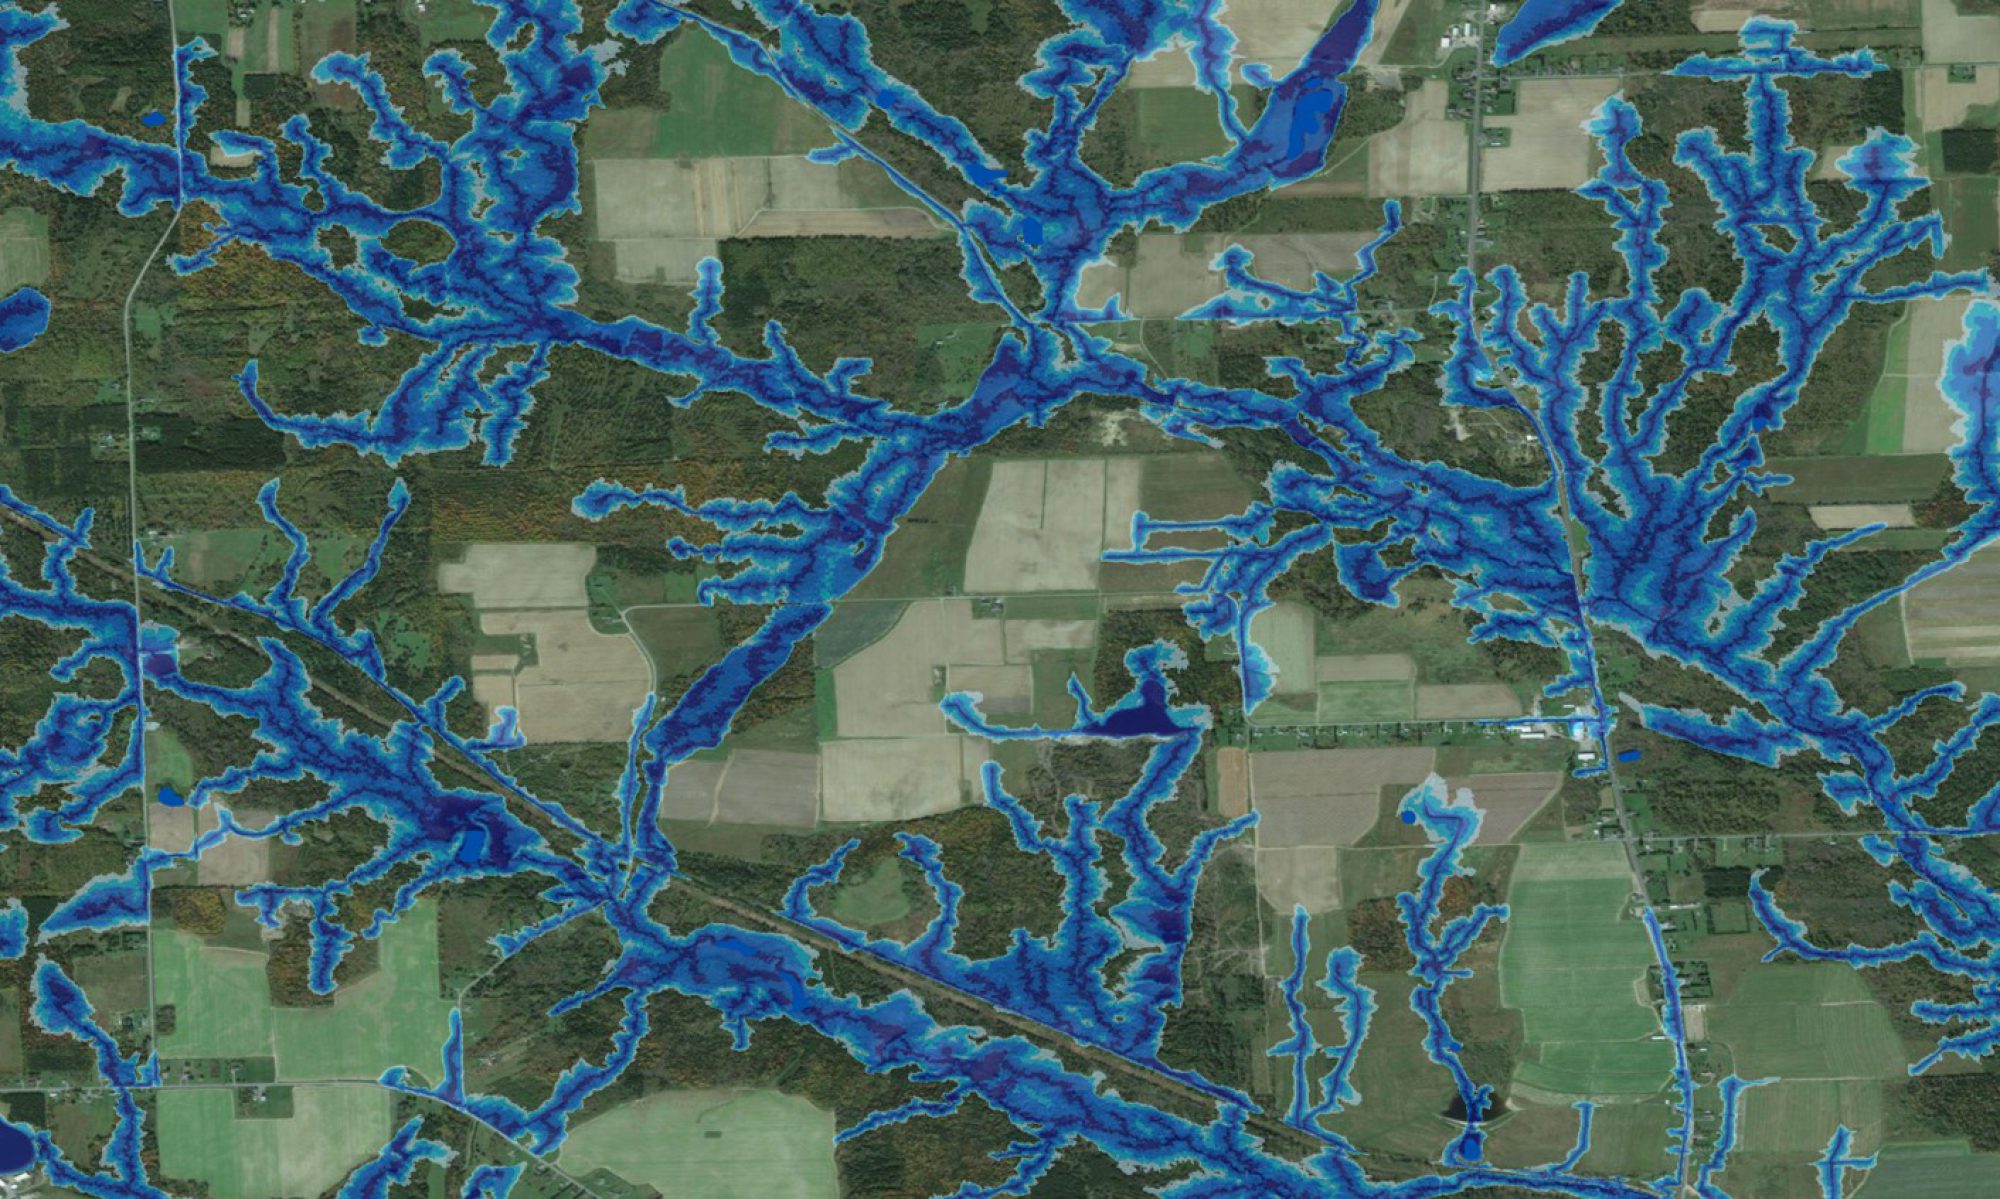
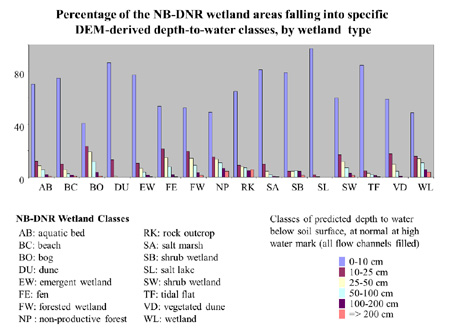
Considering the current controversy regarding the Wetland Conservation Policy for New Brunswick, the newly re-posted Wetland Map for New Brunswick (DNR), and the need “to determine the best way to protect NB wetlands“, we felt it important to show how open-water surfaces, the DNR wetland coverage and soil drainage are distributed across the landbase (for details, click on the images below). This information was derived from NB’s hydrographically corrected digital elevation model (DEM), which has a point density of about 1 point every 30 m, sometimes more, sometimes less. The resulting map was used to display the cartographic determined depth-to-water index as it would exist next to flowchannels, shorelines and within and next to wetlands during high-water mark conditions Through field checking, this mapping is on average +/- 40m within GPS-tracked flow channels and wetland borders, eight times out of ten, and is much more accurate and spatially explicit re. soil drainage than the existing soil survey reports for NB.

The next stage will allow us to do the same at 1 m resolution, at about +/- 4 m, nine times out of 10, using province-wide LiDAR coverage. Work along this has already begun, esp. for the Lower Saint John River Valley, with support from the municipalities in that area including Quispamsis. It is hoped that all interested parties in New Brunswick will join forces to extend the LiDAR coverage across the province asap (current cost: about $20,000,000).
LiDAR-generated DEMs – produced by companies engaged with air-borne LiDAR scanning – are processed at the Forest Watershed Research Centre to delineate wet areas, flow channels, cartographic depth-to-water below the soil surface, soil drainage, vegetation type, and hydrological risks due to, e.g., coastal and inland flooding and slope instabilities. This delineation should be at the base of modern rural and urban development designs. The resulting maps also inform about off-road soil trafficability during wet, moist and dry weather, and alternative road, trail and storm-water pathways before and after development.
For details about the wet-area mapping process, refer to http://watershed.for.unb.ca/WAM. For an example specific to the more exacting process of LiDAR-based wetland delination, click here.
Recommendations
1. Wet-area maps need to accurately reflect conditions within property lines to allow for accurate ecological, economic and environmental assessments by property, and to allow for detailed operations planning on specific parcels of land. LiDAR-derived maps will achieve this for the most part, especially when tailored to account for local infrastructure dealing with, e.g., storm-water management.
2. Wet-area maps do not need to be as accurate for general planning purposes, when it is important to take stock of, e.g., habitat distributions and local hydrological risks associated with flow channels, depressions, and slopes across large areas. The currently available wet-areas map for NB achieves this more or less, and has therefore found extensive use by forest companies, environmental consultants, and wetland, wildlife and park managers. Applications involve access to harvest blocks, in-block layout, locating alternatives routes for road layout, habitat delineation including wetlands, etc.
3. High-resolution wet-area maps form the base for 1-m soil, drainage and vegetation type mapping, from ridge tops to depressions. Coupled with property maps, this will facilitate in-depth and innovative analyses about the land, using various perspectives and contexts, e.g., land-use policy formulation, urban and rural, planning environmental impact assessment, landscape architecture, archaeology, and geological exploration.
4. A major contribution of the wet-area mapping process is that it reveals the topographic nature of soils in urban settings and planning. Even in or especially so in “sustainable development planning” , natural functions and services of soils are often ignored through paving, bull-dozing, and ecologically expensive top-soil replacement. The wet-areas map will allow rural and urban planners to visualize how specific proposals relate to already existing soil conditions and related risks in great detail, and improve their designs accordingly. For an example, refer to the wet-areas map for Fredericton.
5. Experiences with forest companies and park management have shown that using wet-areas maps as planning tool can lead to considerably reduced construction and maintenance costs. Examples are: much improved field reconnaissance; few to no surprises during the construction phase; fewer and less costly culverts and bridges needed by re-aligning proposed roads along gentle slopes and staying away from flowing, seeping or accumulating water; hence: less fill-in by avoiding areas mapped to be wet , less frost heaving, less machine wear-and-tear and down-time, and greater on-the-job satisfaction.
6. Concerns about which of the wet-areas mapped are significant or not can be resolved by relating each such area to its upslope flow-accumulation area: the larger that area, the greater the hydrological risk. For example, small depressions within a small basin pose less concern than small depressions at the bottom of large basins. A trail crossing a narrow flow channel with small flow accumulation may just need a small-sized cross-drain. A similar flowchannel and same size cross-drain donwslope from a large flow-accumulation area will not last. The current map when used with its corresponding flow-channel map will allow planners and property owners to discern the flow-accumulation risk specifically associated with each wet-area already mapped. Across the province, each wet-area entry on tne map can be “risk-coloured” from low (e.g., green) to high (e.g., red).
7. As everyone agrees: wetlands are valuable assets to land, communities and properties. Municipalities, developers and planners are therefore encouraged to make the best of these areas, through innovative designs that also address the flow-accumulating areas above the wet areas. In turn, these innovations will pay back through engendering less costly surprises and maintenance costs while enhancing property qualities and value at the same time and over time.
In the Media

CBC Radio Interview with Dr. Arp on the issues surrounding the predictive wet areas map in New Brunswick
Fredericton Interview (March 25, 2011 at 7:41am)
Moncton Interview (March 25, 2011 at 7:20am)
Publications
- P.N.C. Murphy, J. Ogilvie, K. Connor, P.A. Arp. 2007. Mapping wetlands: a comparison of two different approaches for New Brunswick, Canada. Wetlands 27: 846-854.
- P.N.C. Murphy, J. Ogilvie, P.A. Arp. Topographic modelling of soil moisture conditions: a comparison and verification of two models. European Journal of Soil Science. 2009, Volume 60, Issue 1, Pages 94-109.
- Thompson, J.W., Sorvig, K. 2008. Sustainable Landscape Construction. A Guide to Green Building Outdoors, 2ndEdition. Island Press. Washington, DC.