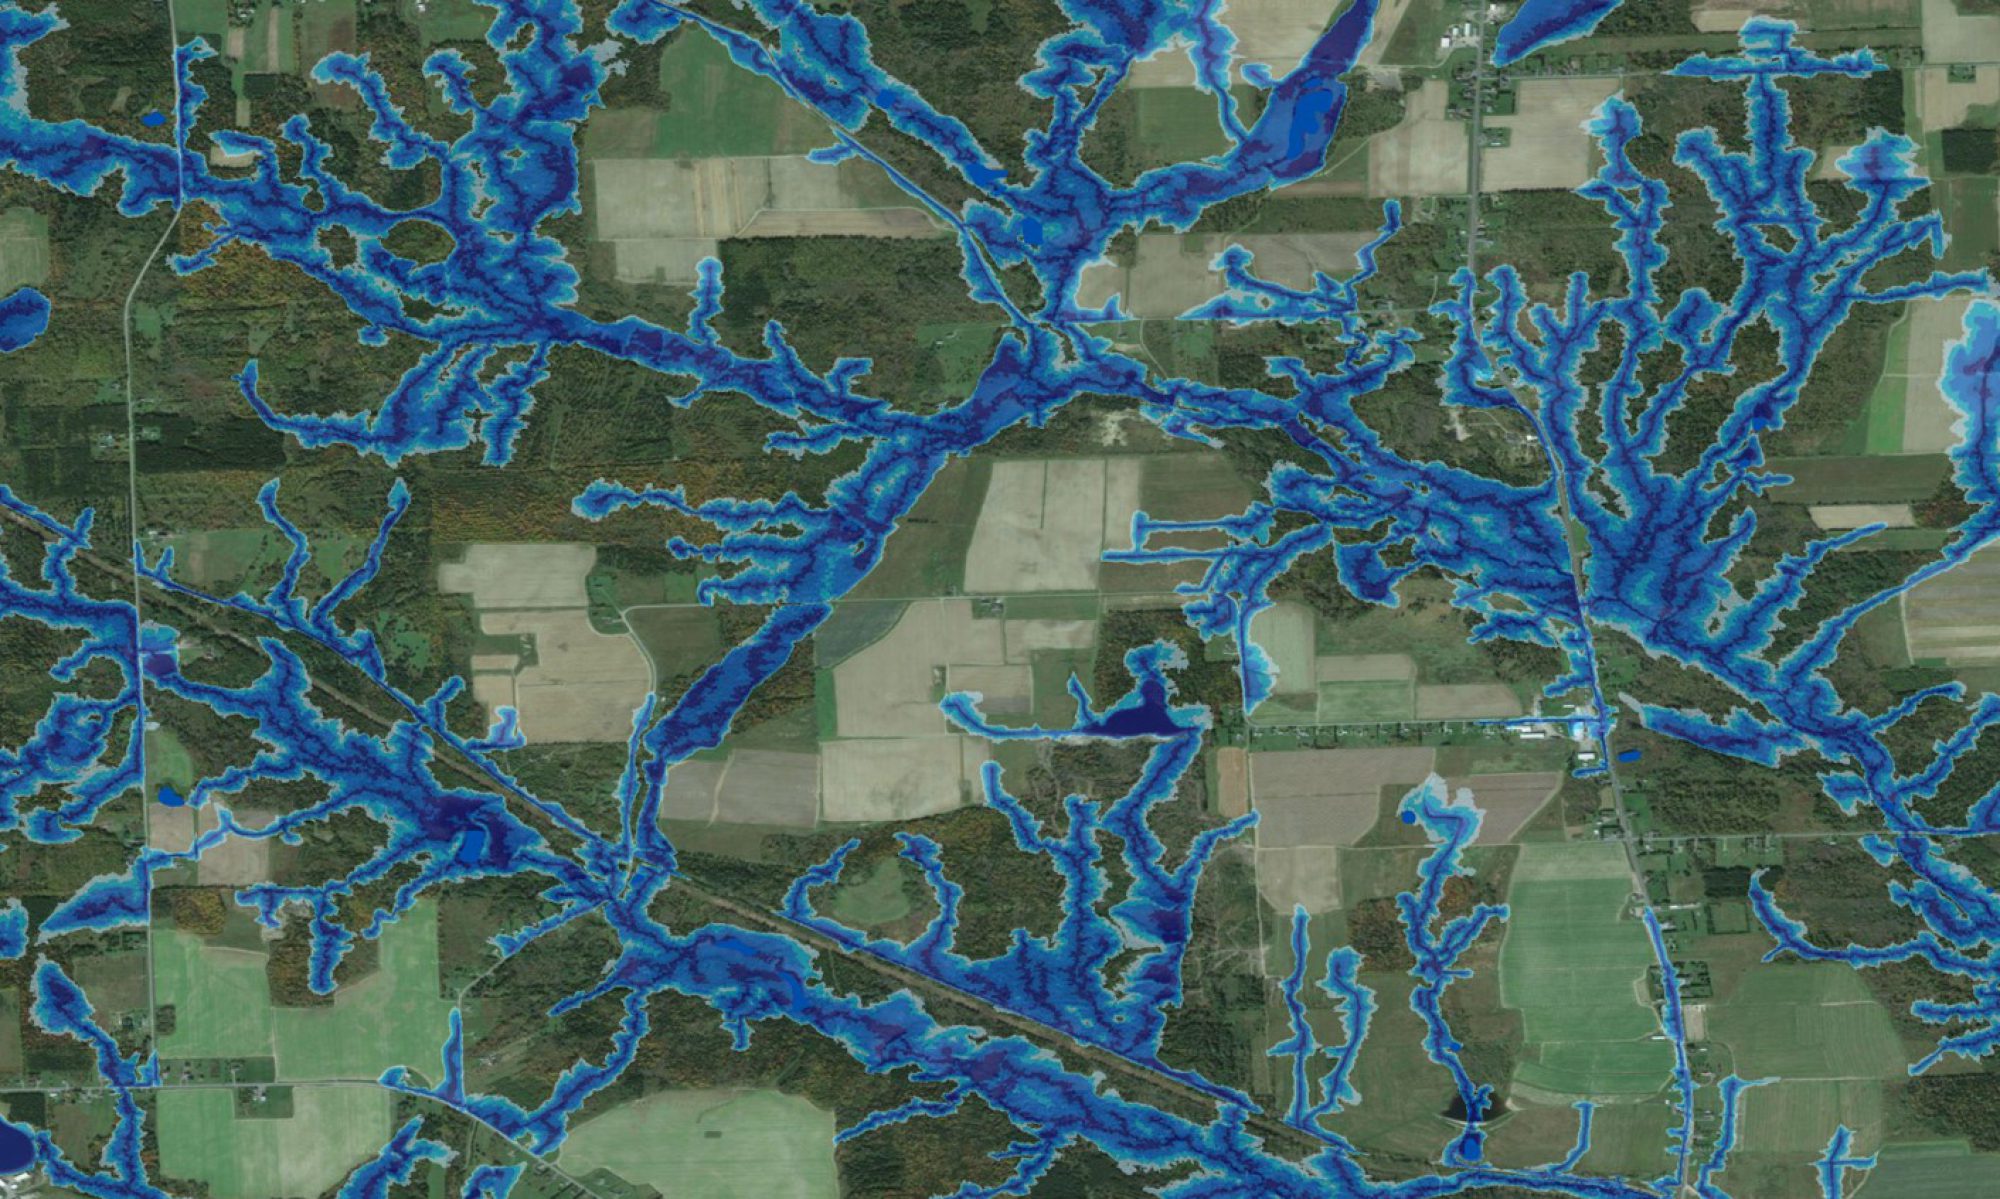
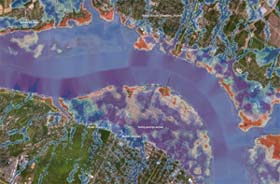
Hydrological risk mapping deals with locating and delineating areas where there would be potential risks in terms of flooding, wash-out, erosion, mudslides and avalanches. Planners working with industry, municipalities and developers are aware of these risks but do require good mapping tools that reveal these risks in a fairly reliable fashion and in sufficient detail. Our approach to hydrological risk mapping involves deriving a number of features from local digital elevation models (DEMs ) and related geomatic themes referring to flow direction, flow accumulation, flow channels, slope gradients, cartographic depth to water (DTW), depth-in-sinks, catchment and sub-catchment areas,and recharge-versus-discharge areas including seepage locations. The DTW index has proven itself to be an excellent indicator of slope position, soil drainage, and local flooding potential. The resulting maps inform about these risks at a glance, and serve as a guide to determine the extent and the connectivities of these risks. The Fredericton map above shows the areas that were likely subject to regular flooding before settlement and urbanization. Subsequent infrastructure developments have generally restricted surface flooding to low-lying areas near the Saint- John River. However, sump pumps within the houses located on the blue-shaded areas still spring into action during very wet weather conditions.
Check out this PDF report about mapping initiatives produced for each city (Nackawic, Florenceville, Meductic, Hartland, and Woodstock).
Presentation
- M. Castonguay, J. Ogilvie, P.A. Arp. Hydrological Risk Mapping for New Brunswick Centered on the Lower Saint John Valley.
Reports
- S. Odsen, M. Pyper. 2017. Ecosystem-based research into boreal forest management: EMEND Symposium 2017 Report
- P.A. Arp. 2016. Land reclamation: How much water? When? Where? Canadian Reclamation 16: 20- 21.
- P.A. Arp. 2015.The Wet-areas and Depth-to-Water Mapping Initiative of the Forest Watershed Research Centre 1997
- P.A. Arp. 2015. ETF 140220 – Extending LiDAR-DEM coverage for flood-prone areas in New Brunswick
- P.A. Arp. 2015. ETF 140219 – Assessing Flood Risk Preparedness in Sussex Corner
- P.A. Arp. 2015. ETF 140156 – Visualizing Hydrographical Relationships between Wetlands and Urban Structures using LiDAR based Wet Areas Mapping (WAM)
- M. Castonguay, J. Ogilvie, P.A. Arp. 2015. World Wildlife Fund Canada – Flow and flood extent mapping for select St. John River valley communities.